
PSK Modulation Implementation with Python
Advertisement
This document explains and provides Python code for Phase Shift Keying (PSK) modulation. The provided script generates PSK modulated waveforms and plots them alongside the original binary data.
Introduction to PSK
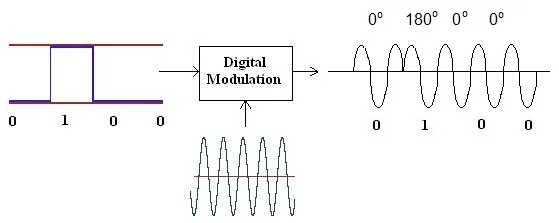
PSK, or Phase Shift Keying, is a digital modulation technique where binary data is represented by varying the phase of a carrier frequency. Typically, a 180-degree phase shift is used to differentiate between binary 1 and binary 0. In the provided Python script, a phase shift of π radians (180 degrees) is utilized.
Here’s a representation of PSK modulation:
-
Equation:
Where:
phaseis for binary ‘1’phaseis for binary ‘0’
An example image illustrating PSK modulation:
Binary Data Generation (Binarygen.py)
The following Python script generates random binary data, which serves as the baseband data for PSK modulation.
def binary(sym, sym_len):
    import numpy as np
    rand_n = np.random.rand(sym)
    rand_n[np.where(rand_n >= 0.5)] = 1
    rand_n[np.where(rand_n <= 0.5)] = 0
    sig = np.zeros(int(sym*sym_len))

    # generating symbols
    id1 = np.where(rand_n == 1)
    for i in id1[0]:
        temp = int(i*sym_len)
        sig[temp:temp+sym_len] = 1
    return sig
PSK Python Script
The following Python script generates a PSK modulated waveform based on the random binary data input.
# This python script generates PSK modulated waveforms
# Library files
import matplotlib.pyplot as plt
import numpy as np
from Binarygen import binary
from math import pi

plt.close('all')

# Carrier wave and binary signal configuration parameters
Fs = 1000  # Samples per second
fc = 50    # Carrier frequency 50 Hz, 50 cycles/sec
T = 1      # Total simulation time in seconds
t = np.arange(0, T, 1/Fs)
Td = 0.1   # Bit duration
Nsamples = int(Td*Fs) # Samples in one bit duration
Nsym = int(np.floor(np.size(t)/Nsamples))

# Binary waveform generation
sig = binary(Nsym,Nsamples)

# PSK waveform generation
phase = pi + pi*sig/2
Xpsk = np.sin(2*pi*fc*t + phase)

# Binary waveform and PSK modulation waveform Plots
figure, axis = plt.subplots(2)
axis[0].plot(t, sig)
axis[0].set_title("Binary digital data")
axis[1].plot(t, Xpsk, 'r')
axis[1].set_title("PSK modulated signal")
plt.tight_layout()
plt.show()
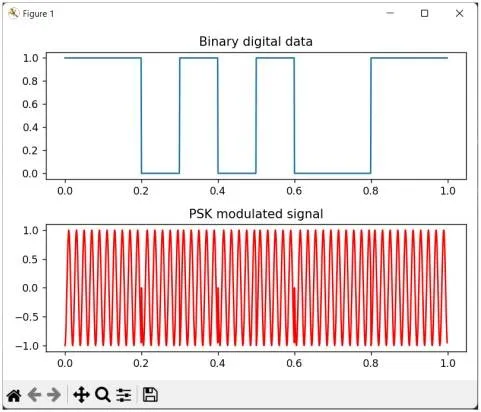
Output Plots
The following plots illustrate the binary input data and the resulting PSK modulated waveform generated by the Python code above.
Explore Python Codes on Wireless Communication & Modulation Simulations
- AM Modulation Simulation in Python
- FM Modulation in Python
- PM Modulation with Python
- ASK Modulation in Python
- FSK Modulation in Python
- BPSK, QPSK, QAM Modulation in Python
- QPSK Mapper / Demapper Python Code
- OFDM Transmitter Simulation in Python (WiMAX)
- Generalized OFDMA Simulation with Python
Continue Learning Python Basics
Continue Learning Modulation Types
- AM Vs. FM Vs. PM : Difference between Analog Modulation Techniques
- ASK Vs. FSK Vs. PSK : Difference between Digital Modulation Techniques
- PAM Vs. PWM Vs. PPM : Difference between Pulse Modulation Techniques
- BPSK Vs. QPSK : Key Differences
- 16-QAM Vs. 64-QAM Vs. 256-QAM : Key Differences
- 512-QAM Vs. 1024-QAM Vs. 2048-QAM Vs. 4096-QAM
- 4096QAM Modulation Used in Wi-Fi 7
- MSK Vs. GMSK : Modulation Technique used in GSM
- LORa Modulation Used in LoRaWAN
- 10% ASK & 100% ASK Modulation used in NFC
- OOK Vs. VPPM Vs. CSK : Visible Light Communication (VLC) Modulation Techniques
- QPSK Vs. OQPSK Vs. PI/4 QPSK
- PAM4 Modulation Used in Gigabit Ethernet
- CCK Vs. DSSS Vs. OFDM Used in WLAN (Wi-Fi) Standards