
AWGN Python: Adding Noise Based on SNR (dB)
By RF Wireless Expert Team
Advertisement
This article explains how to add Additive White Gaussian Noise (AWGN) to a signal vector in Python, based on a desired Signal-to-Noise Ratio (SNR) in decibels (dB). The following formulas are used to generate random samples of Gaussian noise that are added to the signal vector, matching its length.
There are two primary methods for adding AWGN to a signal:
- Based on a desired SNR.
- Based on a known noise power.
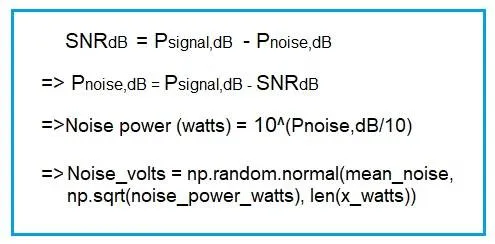
The following equations are used in the Python script to add the Gaussian noise vector to the signal vector according to the desired SNR in dB.
AWGN Python Code Based on Desired SNR (dB)
# This python script can be used to add noise as per desired SNR (dB)
import numpy as np
import matplotlib.pyplot as plt

target_snr_db = 15  # Desired target SNR in dB

# sine waveform generation with time vector
t = np.linspace(1, 100, 750)
x_volts = 20*np.sin(t/(2*np.pi))
x_watts = x_volts ** 2
x_db = 10 * np.log10(x_watts)

# Calculate signal power and convert to dB
sig_avg_watts = np.mean(x_watts)
sig_avg_db = 10 * np.log10(sig_avg_watts)
print("SMR in dB = ", sig_avg_db)

# Calculate noise and convert it to watts
noise_avg_db = sig_avg_db - target_snr_db
print("Average Noise power in dB = ", noise_avg_db)
noise_avg_watts = 10 ** (noise_avg_db / 10)

# Generate samples of white noise
mean_noise = 0
noise_volts = np.random.normal(mean_noise, np.sqrt(noise_avg_watts), len(x_watts))

# Add noise to original sine waveform signal
y_volts = x_volts + noise_volts

# Plots in dB
y_watts = y_volts ** 2
y_db = 10 * np.log10(y_watts)

# Plots
figure, axis = plt.subplots(3, 2)
axis[0,0].plot(t, x_db)
axis[0,0].set_title("Signal voltage vs time")
axis[0,1].plot(t, x_watts)
axis[0,1].set_title("Signal power (Watts) vs time")
axis[1,0].plot(t, x_db)
axis[1,0].set_title("Signal power (dB) vs time")
axis[1,1].plot(t, noise_volts)
axis[1,1].set_title("Gaussian noise vs time")
axis[2,0].plot(t, y_volts)
axis[2,0].set_title("Signal with noise vs time")
axis[2,1].plot(t, y_db)
axis[2,1].set_title("Signal with noise (dB) vs time")
plt.tight_layout()
plt.show()
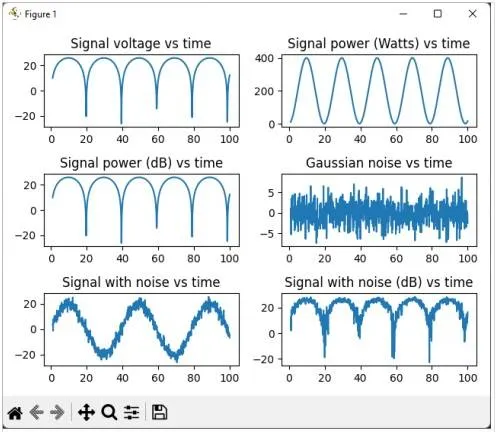
AWGN Output Plots
The plots below illustrate the output of the AWGN Python code:
Continuous Learning Noise Fundamentals & Mitigation
- Understanding Noise Sources and Types
- White Noise vs Colored Noise
- Noise Generation Sources & Reduction Techniques
- Power Supply Noise Reduction Techniques
Explore Simulations, Code & Advanced Applications
- MATLAB Phase Noise Impairment
- Pseudorandom Noise (PN) Sequence Basics (MATLAB Code)
- Artificial Noise Injection in 6G Wireless Security
Continuous Learning Noise Metrics: Figure, Factor & Temperature
- Noise Factor vs Noise Figure
- Noise Figure vs Noise Temperature
- Sensitivity vs Noise Figure (GSM, DECT, GPS)
- SNR vs CNR (Signal-to-Noise Ratio vs Carrier-to-Noise Ratio)
- Understanding OSNR (Optical Signal-to-Noise Ratio)
- RF Phase Noise Measurement using a Spectrum Analyzer