Plotting with Waveform Charts and Graphs in LabVIEW
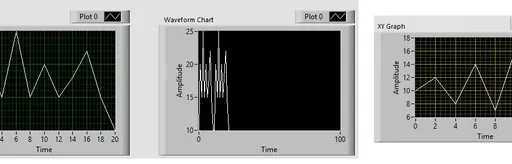
Learn how to use Waveform Charts, Waveform Graphs, and XY Graphs in LabVIEW for effective data visualization. Download example LabVIEW source code.
Advertisement
Trace every article connected to this tag across guides, explainers, and practical RF topics. This view is especially useful when the same concept spans multiple categories.
Articles
1
Showing
1-1
Pages
1/1
Where this tag appears most
Open the categories where this topic shows up most often.
Advertisement
Tagged Articles
Showing 1-1 of 1 articles tagged with Waveform Graph.
Learn how to use Waveform Charts, Waveform Graphs, and XY Graphs in LabVIEW for effective data visualization. Download example LabVIEW source code.
Advertisement