
Plotting with Waveform Charts and Graphs in LabVIEW (Part-5)
Advertisement
The following plots are available under Controls Palette/Graph Inds and are among the most commonly used:
-
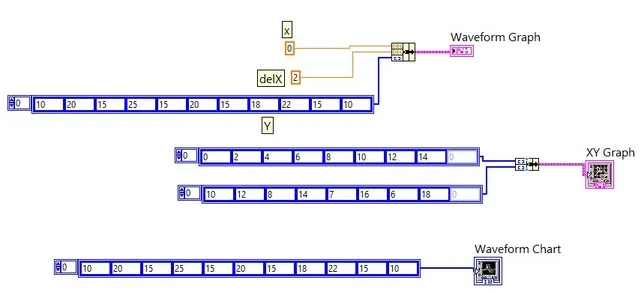
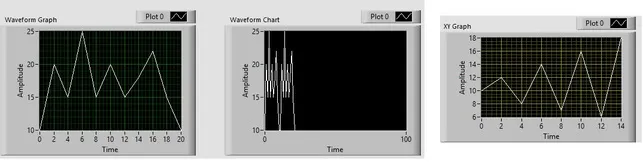
Waveform Chart: A numerical indicator used to display single or multiple plots. It receives numerical data one value at a time, making it ideal for use within loops.
-
Waveform Graph: Another numerical indicator capable of displaying single or multiple plots. However, it receives data in an array and then plots it. This is well-suited for use outside of loops when you’re not concerned with the data until it’s completely collected.
-
XY Graph: This LabVIEW graph accepts two inputs in the form of a cluster, specifically X and Y arrays. It’s valuable for analyzing non-real-time data, such as a force vector versus a distance vector.
Example Block Diagram
Here’s an example block diagram illustrating plotting in LabVIEW:
Example Front Panel
Here’s the corresponding front panel for the LabVIEW VI:
Continue Learning Labview Programming Tutorial Series
- Labview Programming : Part-1 (Creating a VI, Data Types, Syntax, Example)
- Labview Programming : Part-2 (Creating a SubVI in LabVIEW: Step-wise Guide)
- Labview Programming : Part-3 (LabVIEW Array Creation and Operations)
- Labview Programming : Part-4 (LabVIEW Cluster Basics: Grouping Mixed Data Types)
- Labview Programming : Part-6 (LabVIEW File I/O: Text and Complex Data Handling)
- Labview Programming : Part-7 (LabVIEW For Loop, While Loop & Case Structure)
- Labview Programming : Part-8 (Local vs. Global Variables in LabVIEW)