 RF
RFAuto-Correlation and Cross-Correlation with Python
Advertisement
This article provides Python code examples for calculating auto-correlation and cross-correlation. This code is useful in simulating time offset estimation, particularly in OFDM/OFDMA systems.
Introduction to Correlation
Cross-correlation helps determine the similarity between two signals. Auto-correlation, which is correlating a signal with itself, is useful for identifying signal features, even when the signal is impaired.
Correlation has many applications:
- Pattern recognition
- Signal detection
- Security systems
Auto-correlation involves correlating a signal with itself or a shifted version of itself. Cross-correlation, on the other hand, correlates two different time-series signals.
Correlation Python Script
The following Python script demonstrates cross-correlation and auto-correlation. Modify the in1 and in2 input vectors to experiment with both functionalities.
# Auto and Cross correlation python code
import numpy as np
import matplotlib.pyplot as plt
import pandas as pd

# This is cross correlation part
# in1=[1, 2, 3, 4, 5, 6,7,8,9]
# in2=[11,12,13,14,15,16,17,18,19]

# This is for auto correlation part
in1=[1, 2, 3, 4, 5, 6,7,8,9]
in2=[0,0,0,0,1, 2, 3, 4, 5, 6,7,8,9]

print(in1)
print(in2)

if len(in1) > len(in2):
    pad = len(in1)-len(in2)
    in2=np.append([in2],[np.zeros(pad)])
elif len(in1) < len(in2):
    pad = len(in2)-len(in1)
    in1=np.append([in1],[np.zeros(pad)])

out_len = len(in1)
out = np.zeros(out_len)
corr = np.corrcoef(in1, in2)
print(corr)

tmp= in2
tmp = np.transpose(tmp)
i = 0
while i < out_len:
    out[i] = in1[i] * tmp[i]
    i += 1

indexMaxValue = max(out)
print(indexMaxValue)
peak_index = pd.Series(out).idxmax()+1
print("Number of zeros in delayed vector =", len(in2)- peak_index)
print("Index of Max or peak value from start i.e. position 0 =", pd.Series(out).idxmax())

plt.plot(out)
plt.show()
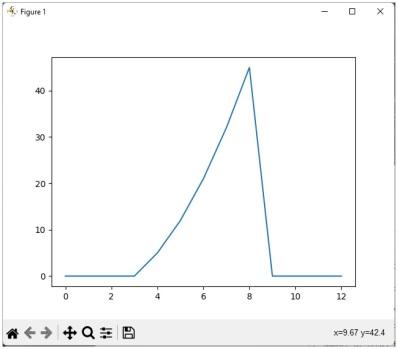
Auto Correlation Example
Here’s how to use the script for auto-correlation, along with the expected output and a plot of the results.
Input:
# This is for auto correlation part
in1=[1, 2, 3, 4, 5, 6,7,8,9]
in2=[0,0,0,0,1, 2, 3, 4, 5, 6,7,8,9]
Output:
Number of zeros in delayed vector = 4
Index of Max or peak value from start i.e. position 0 = 8
Plot:
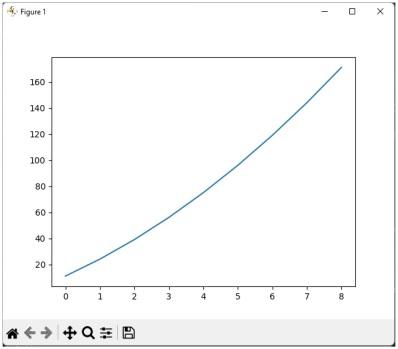
Cross Correlation Example
Now, let’s look at an example of using the script for cross-correlation, including input, output, and plot.
Input:
# This is cross correlation part
in1=[1, 2, 3, 4, 5, 6,7,8,9]
in2=[11,12,13,14,15,16,17,18,19]
Output:
Number of zeros in delayed vector = 0
Index of Max or peak value from start i.e. position 0 = 8
Plot:
Advertisement


