 RF
RFConstellation Diagram vs Eye Diagram: Key Differences
Advertisement
This page describes the basics of a constellation diagram and an eye diagram, and outlines the difference between them. In digital modulation, the baseband signal is separated into in-phase (I) and quadrature-phase (Q) components.
The combination of I and Q is known as the baseband modulating signal. In vector modulation, amplitude and phase vary to generate symbols.
After vector modulation, the modulating signal becomes a modulated signal. This modulated signal can be represented in various formats or diagrams, including the constellation diagram, eye diagram, CCDF curve, and power spectrum.
Refer to PHY measurements for more information.
Constellation Diagram
It’s also referred to as an IQ diagram. The constellation diagram represents all the possible modulated symbols used by a modulation technique to map information bits.
These different symbols are represented in the complex plane with their amplitude and phase information.
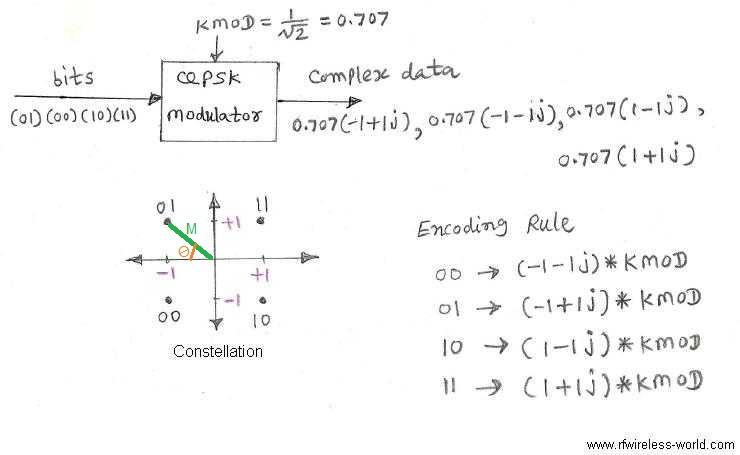
Figure 1 depicts a QPSK constellation diagram. As shown, two information bits make one symbol. For example, ‘01’ represents 0.707*(-1+1*j).
This is represented in the constellation diagram as a dot with magnitude ‘M’ and angle ‘θ’ values as expressed below:
- Magnitude M = √(I² + Q²)
- Angle θ = tan�?�¹(Q/I)
In QPSK, there are four possible symbols for the information bits. All four combinations are represented in the constellation diagram.
Refer to QPSK modulation and QAM modulation types for more information.
Error Vector Magnitude is derived from the constellation diagram. Refer to EVM for more information.
Baseband Data Eye Diagram

In wireless digital communication, the eye pattern is referred to as the eye diagram.
This is obtained using an oscilloscope. It’s generated when digital data is sampled and applied to the vertical input of the CRO, and the data rate is applied as a trigger for the horizontal sweep.
Different modulation types will have different eye diagrams. It’s used to evaluate the performance of baseband transmission in the presence of a noisy channel environment.
An open eye represents less distortion in the signal. Hence, the more open the eye, the better the received modulated signal.
Various measurements can be achieved using the eye diagram.
Amplitude measurements include eye amplitude, eye height, and eye SNR.
Time measurements include eye delay, eye fall time and rise time, crossing time, peak-to-peak jitter, and random jitter.
The following measurements can be interpreted using the eye diagram:
- Eye opening: Indicates additive noise in the signal.
- Eye Width: Indicates timing synchronization and jitter effects.
- Eye overshoot/undershoot: Indicates peak distortion due to interruptions in the signal path.
Advertisement


