 RF
RFPERT Chart vs. Gantt Chart: Key Differences Explained
Advertisement
This article compares PERT charts and Gantt charts, highlighting the differences between them. We’ll also touch upon related concepts.
PERT Chart Explained
PERT stands for “Program Evaluation and Review Technique.” A PERT chart is essentially a network diagram.
In Critical Path Method (CPM), activity durations are often based on historical data from activities performed many times before. But what happens when an activity is brand new and has never been done before within the organization? This is where PERT becomes particularly useful.
The key difference between CPM and PERT lies in how they handle timelines:
- CPM: Used when activity timelines are deterministic (i.e., predictable).
- PERT: Used when activity timelines are not deterministic (i.e., uncertain).
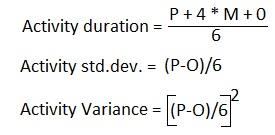
Fig.1 PERT uses three time estimates to come to a conclusion regarding time estimates for a activity.
PERT utilizes three time estimates to determine the overall time estimate for an activity:
- Optimistic Time (O): The shortest possible time the activity could be completed in.
- Pessimistic Time (P): The longest possible time the activity might take.
- Most Likely Time (M): The most probable completion time.
The figure above illustrates equations to calculate activity time duration, standard deviation, and variance. The formulas would be:
- Expected Time (TE) =
- Standard Deviation (SD) =
- Variance (V) =
Gantt Chart Explained
A Gantt chart is a time and activity bar chart. These charts are relatively simple and display a project schedule in task sequence, showing the start and finish dates for each task.
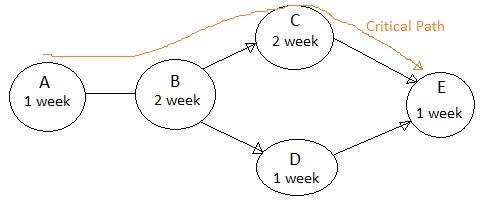
Fig.2 Figure-2 depicts simple activity network diagram mentioning activity and time duration in weeks.
Figure 2 depicts a simple activity network diagram showing activities and their durations in weeks. Activity A requires 1 week, B requires 2 weeks, C requires 2 weeks, D requires 1 week, and E requires 1 week.
A simple Gantt chart for these activities is shown in Figure 3. As mentioned earlier, a Gantt chart illustrates time and activities. Activities are listed on the vertical axis, and the time scale is on the horizontal axis. Each activity bar represents the duration of a specific task (A to E in this example).
However, Gantt charts have limitations. They don’t clearly show dependencies or relationships between tasks (e.g., which task must come before another). They also don’t distinguish between critical and non-critical tasks.
Gantt charts are best suited for presenting a summary of the entire project to top management because they don’t contain detailed information about every activity.
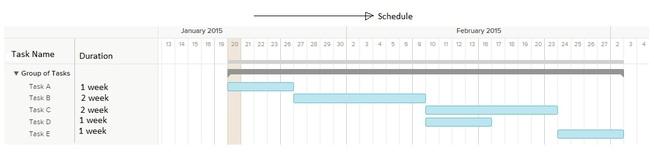
Fig.3
Advertisement


